
By Kevin Robles
For most of my childhood, I crossed an international border every morning to get to school, leaving Agua Prieta in Sonora, Mexico, and entering Douglas, Arizona, before the first bell. The crossing became part of my routine, but the contrast between the two places never disappeared because the language, humor, expectations, and rules around me could shift within minutes. I learned to notice what carried over from one place to the other, what needed to change, and when an assumption that had worked yesterday no longer fit the situation in front of me.

Source: LIMO 5, Wikimedia Commons
I did not have a name for that kind of reasoning at the time. I only knew that past experiences were useful, but they could not answer every new situation on their own. This summer, while working on a maize yield project with CROPPS at the Boyce Thompson Institute and Cornell University, I found a statistical framework built on the same general idea. Bayesian inference begins with what seems reasonable based on prior information, compares it with new evidence, and then updates the original estimate based on the evidence. The equations were new to me, but the way of thinking behind them felt familiar.
Bayesian models: The basic framework
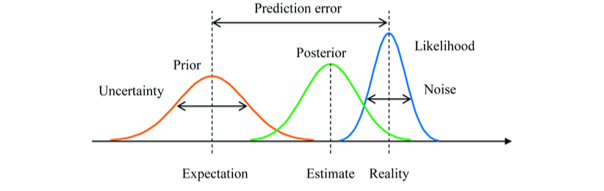
Source: Sarowar Ahmed, Medium
A Bayesian model begins with a range of answers that would make sense before the new data are examined. That starting range is called a prior. In my project, for example, I might begin with a broad idea of when a maize plot is likely to reach its fastest growth based on what is known about maize development and what the other plots in the experiment usually do. I then compare those possible answers with the measurements collected from the plot. A possible answer that produces a curve close to the observed data receives more support, while an answer that produces a poor match receives less. The updated range of answers is called the posterior, which is the model’s best description of what now seems likely after considering both the starting information and the new measurements.
The likelihood is the part of the model that makes this comparison. It does not add another opinion or assumption. It measures how well each possible set of values could have produced the observed data. Suppose the initial information suggests that the fastest growth will probably occur between 50 and 70 days, but the measurements consistently point to an earlier date, near day 45. The model will shift its estimate earlier. If the plot has only two noisy measurements, the shift will usually be smaller because the data cannot support a very exact conclusion. If the plot has many clear measurements, the data has more power to move the result.
Source: Mark Riehl, Wikimedia Commons
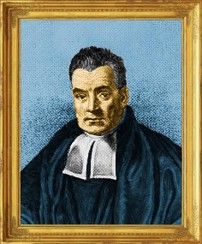
Bayesian inference is named after Thomas Bayes, an English Presbyterian minister and mathematician who lived from about 1701 to 1761. His work on inverse probability was published after his death in 1763 by Richard Price. It introduced an early method for using observed evidence to estimate an unknown probability, which later became one of the foundations of modern Bayesian statistics.
This is useful in field research because the evidence is rarely equally strong across all plots. Some plots have clear measurements across the season, while others may have missing flights, unusual values, or weaker signals. Bayesian inference allows the model to be more confident where the data are clear and more cautious where the data leave room for several explanations, rather than pretending that every curve is known with the same level of certainty.
The role of hierarchical structure
My dataset contains repeated drone measurements across many maize plots, with each plot associated with a genotype and an experimental class. One option would be to fit every group separately, but a group with only a few useful measurements could end up with an extreme or unrealistic growth curve because there is not enough information to guide the estimate. The opposite option would be to combine all the groups into a single average curve, which would be more stable but would erase the differences the experiment was designed to study.

Source: Carl Young, Wikimedia Commons
A hierarchical Bayesian model works between those two extremes. Each group receives its own growth curve, but the curves are connected because they come from the same field experiment and share the basic biology of maize. When a group has limited or noisy data, the model can learn from the broader pattern across the experiment instead of relying on that weak record alone. When a group has a clear seasonal pattern, its own measurements can pull it away from the average. The groups share information, but they are not forced to look the same.
Why did Bayesian models feel intuitive?
The connection to my childhood is not that people behave like equations or that culture can be reduced to a statistical category. What felt very similar was the need to carry over prior knowledge into a new setting without assuming it would fit perfectly. Crossing between Agua Prieta and Douglas taught me to begin with expectations shaped by family, school, language, and experience, then pay attention to what the new setting was actually telling me and revise those expectations when they no longer matched.
A hierarchical model handles a related balance between the individual group and the larger population. It does not treat each maize group as though it has nothing in common with the others, and it does not flatten every group into one average example. Information from both levels shapes the result, while the model keeps track of how much the data truly support each conclusion.
Learning Bayesian statistics has made me more careful about where a model’s assumptions come from, how strongly the data support a result, and when an estimate should remain uncertain. Long before being exposed to statistics, I had already learned a simpler version of the same lesson, which is to begin with what you know, watch what happens, and be willing to change your understanding when the evidence gives you a reason to do so.
About the author

As of summer 2026, I am a rising senior at the University of Arizona, double majoring in Information Science (Data Science emphasis) and Psychology, with minors in Statistics & Data Science and in Spanish, through the W.A. Franke Honors College. This summer, I was a CROPPS REU intern at the Boyce Thompson Institute and Cornell University, funded by the Center for Research on Programmable Plant Systems (CROPPS) and mentored by Professor Kelly Robbins and PhD student Dinesh Ghimire. Please feel free to reach out with any questions at kevinrobles1@arizona.edu. Thank you for reading about my research.